Weekly Oil Report: Market Sentiment Keeps Changing


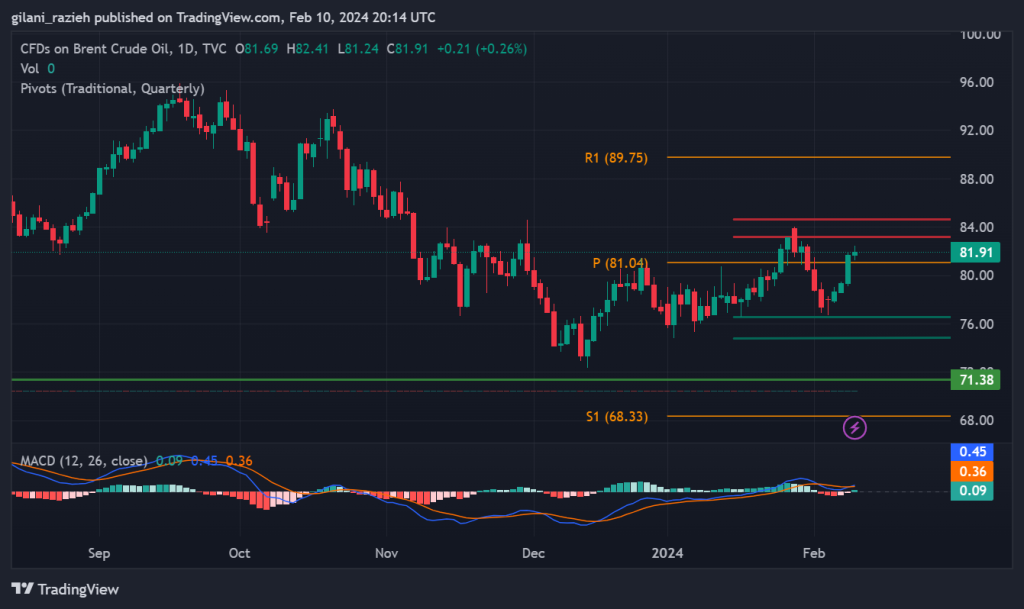
On Friday, Brent closed at $81.91 and WTI settled around $76.54. Watch crude technical analysis and comment your ideas:
The weekly chart of Brent shows a fine portion of growth but it’s still beyond last week’s engulfing candle. If you check the daily chart, the trend has been upward since December 12 and it hasn’t shown any change of character yet. Resistances and supports are also shown to monitor the movements.
The sentiment suddenly turned bullish due to ceasefire rejection, US limited supply, Saudi plans, and new interviews on the Ukraine war.
Israel rejected the ceasefire plan and it launched a new attack in the region. The war is about to expand because of new coming attacks.
The US oil drilling activities decreased last week according to new data. Saudi also ordered Aramco to avoid any expansion plans and maintain oil production at 12 million barrels per day.
The war in Ukraine also shows no sign of ending. In the new interview of Putin with Tucker Carlson, it seems that the war will continue.
Following crude oil, bitumen price was on an upward trend in February too. India once increased the price by 9.5 USD, and it’s about to implement another 9.5 USD increase in mid-February. Singapore and South Korea also raised prices. Europe prices are upward because of the cold wave. In Iran, the situation is almost the same and rates are increasing at a low pace.
Feel free to contact me for bitumen inquiries or more information.
| Location | Price (USD) |
| Iran (bulk) – BND FOB | 288-295 |
| Singapore Bulk | 430-435 |
| South Korea Bulk | 400 – 405 |
| Bahrain Bulk | 360-365 |
This article was prepared by Mahnaz Golmohammadian, the export manager of Infinity Galaxy (www.infinitygalaxy.org).


